Summary
The summary tab is the first screen you will see after login into the dashboard.

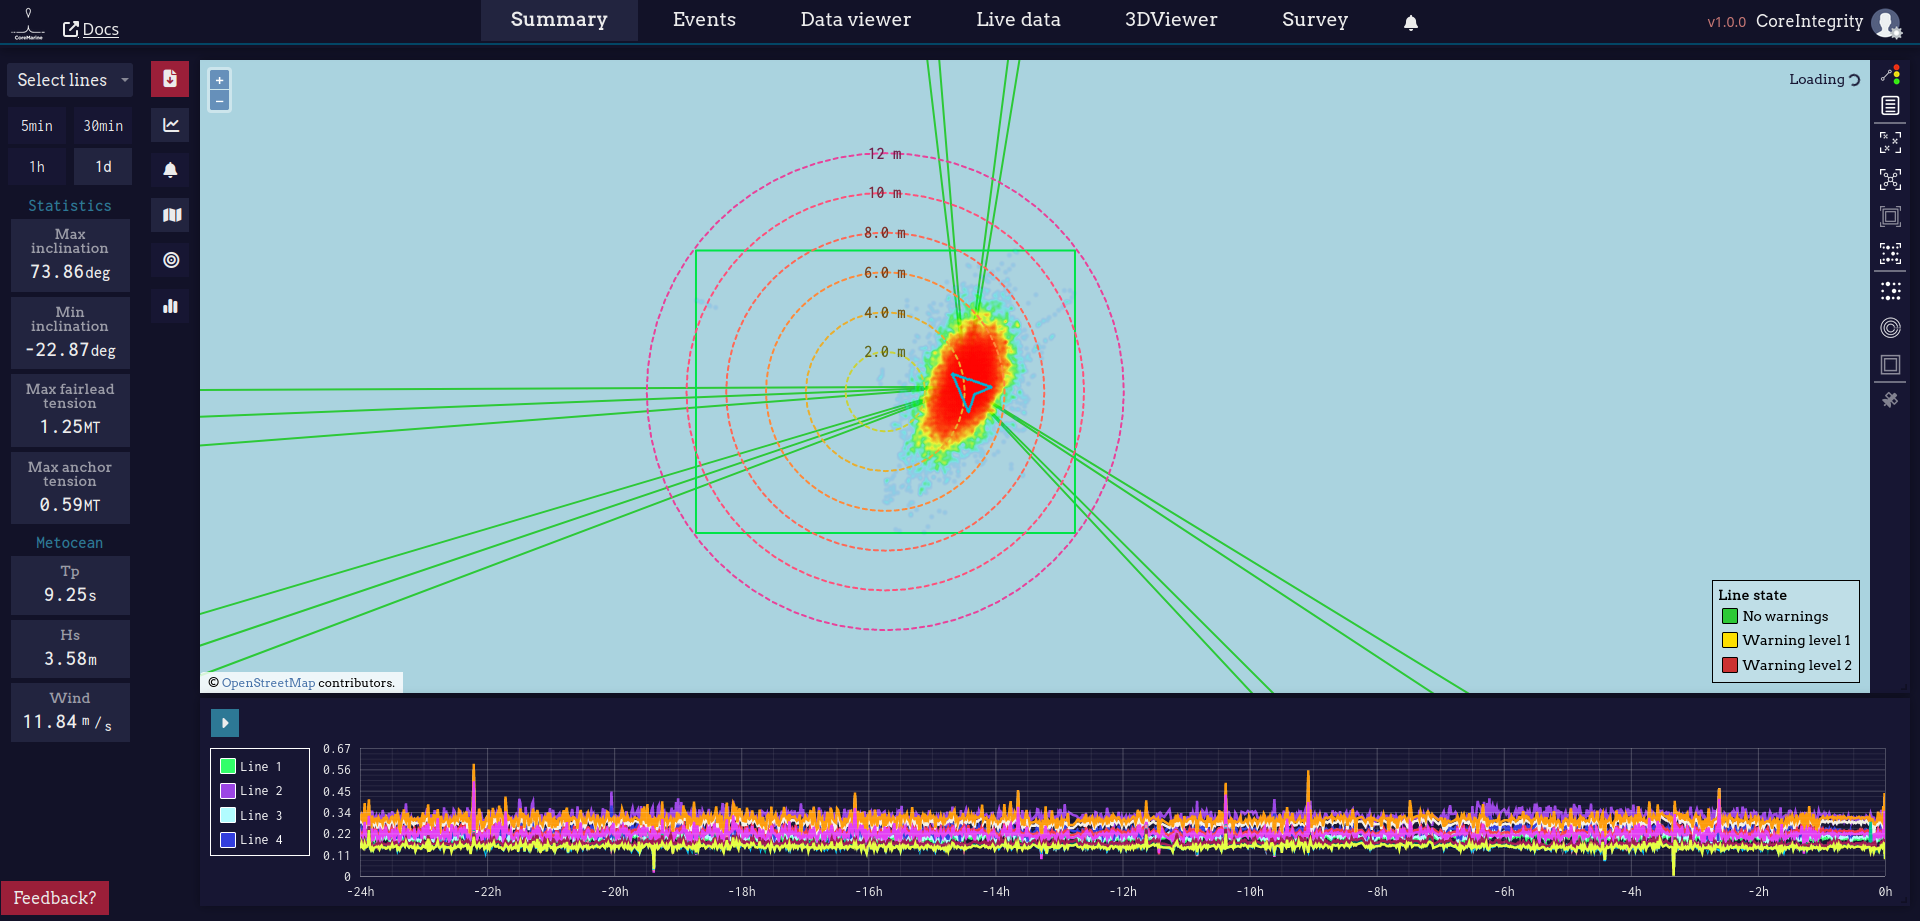
The summary view is split on several items, which can be customized, either repositioning them by click & drag or by showing/hiding them as it is documented below.
Left panel
At the left of the Summary view there is a fixed panel which cannot be hidden.

The left bar itself is split in 3 main subsections.
Data plot control
In the upper part of the left panel the user can select the active lines by pressing on Select lines button. The active lines are the ones that will be plotted on the Statistics, Chart, Events and Line state subsections.
Right below the Select lines button you have 4 buttons to set the considered time lapse among 4 options:
- 5 minutes (default)
- 30 minutes
- 1 hour
- 1 day
Statistics
The next subsection of the left bar are the statistics. The statistics show the maximum and minimum inclination (degrees from the horizontal) of the selected lines at the fairleads, as well as the maximum and minimum tension (MTons) at those same fairleads. Such statistics are collected along the selected time period at the Data plot controls.
Metocean
The sea state is provided at the current position of the platform by the peak period and significant wave height of combined wind and swell waves. The wind speed is also provided.
View controls
Besides the left panel the user can find the view controls, which allows to customize the elements shown on screen. They will be documented below.
It also allows to generate a report:
The report will be a .docx Microsoft Office document where all the information presented on the summary view is compiled.
Map
The map view is shown by default on the center of the summary view. The user can show and hide it with the Display map button.
On such map the position of the platform, as well as a schematic view of the lines is depicted. Such view can be customized with the controls disposed at the right side of the map view.

The following actions can be done with such controls:
- Select the lines color representation. Either the lines state, utilization or damage
- Show/hide the lines color legend.
- Fit the view on all the available assets
- Fit the view on the current asset
- Fit the view on the actual asset motions bounding box
- Show/hide the excursion heatmap
- Show/hide the radial excursion ruler
- Choose between the map or the satellite views
Note that the information presented on the map is refered to the GNSS position, not the center of the platform. Along the same line, the excursion ruler is centered on the geometrical center of the positions visited by the GNSS, not the as-left position of the paltform.
To know more about the excursions of the platform respect to the as-left position please use the Excursion chart.
Chart
The chart view is by default shown on the bottom side of the summary view. The user can show and hide it with the Display chart button.
At the chart the selected data for the active lines, along a certain time period, is plotted. The specific data to be plotted can be selected pressing on the button with a triangle at the top-left corner of the chart.

while the active lines and considered time period can be selected at the left panel.
Events
The events panel is hidden by default on the summary view. The user can show and hide it with the button Display events
The information shown in this panel is similar to the one shown on the Events tab, and thus it is not documented here.

Excursion chart
The excursion chart is hidden by default on the summary view. The user can show and hide it with the button Display the excursion chart
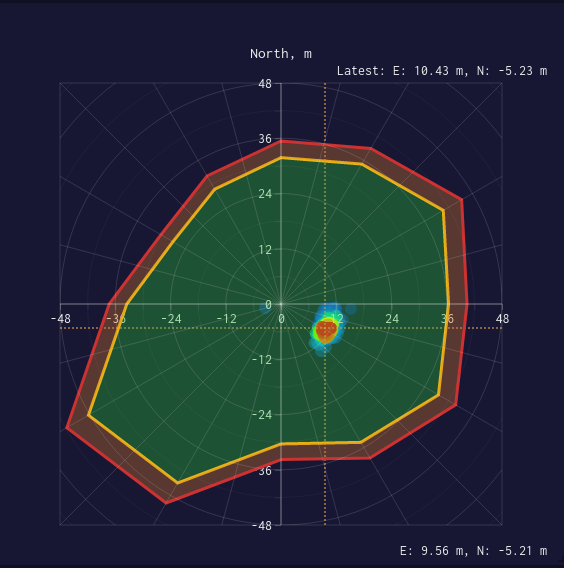
On the excursion chart the heatmap of the asset excursions, with respect to the as-left position, is shown. The offset threshold polygons are shown as well. The offset polygons are the ones considered to trigger alarms due to an excessively large excursion of the platform.

Lines state
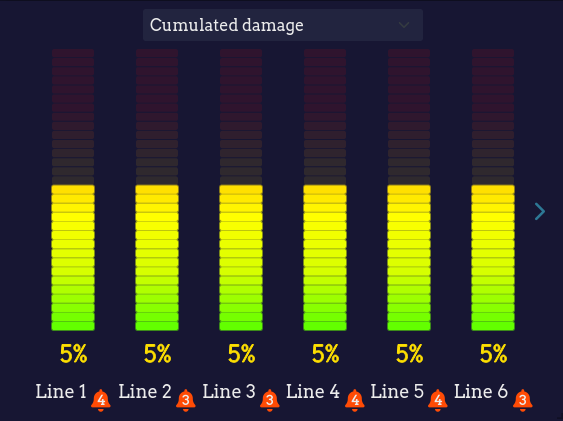
The lines state panel is hidden by default on the summary view. The user can show and hide it with the button Display lines state
The information shown in this panel is similar to the one shown on the Events tab, and thus it is not documented here.
