Data viewer
The Data Viewer tab can be used to plot the data records.

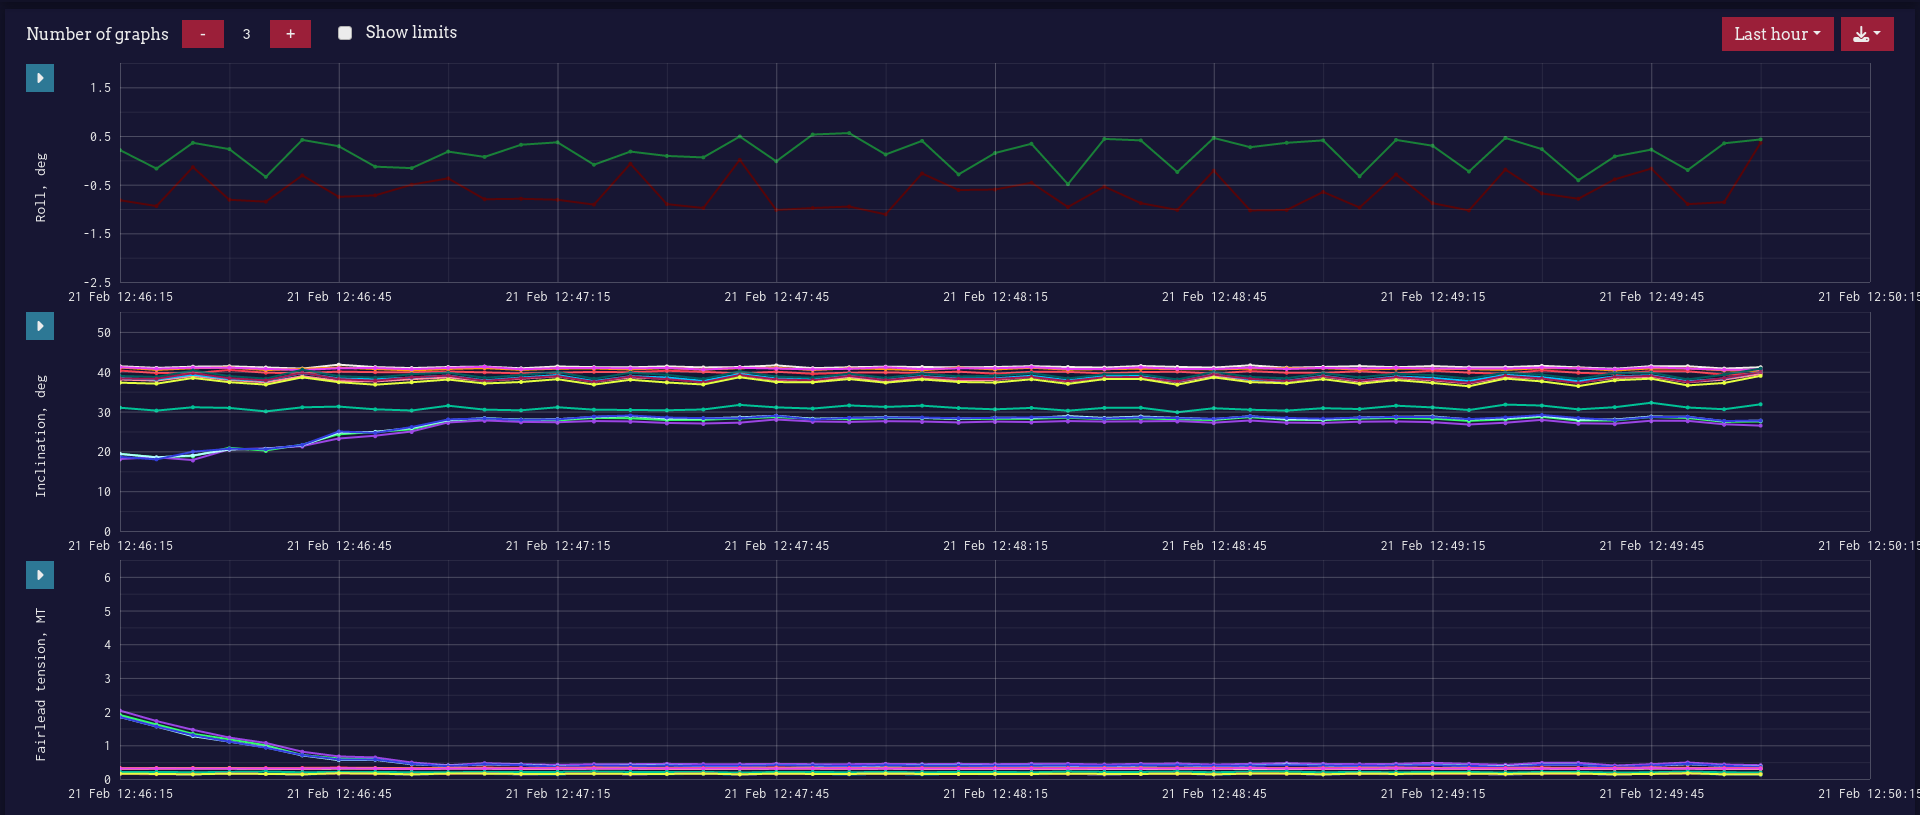
By default, the data viewer will show the lines inclination and tensions at the fairlead and anchor during the last hour.
The number of plots can be selected with the controls on the top-left corner. A minimum of 1 plot and a maximum of 5 plots can be shown.
Besides those controls, there is an option to show the threshold values to trigger alarms, when applicable.
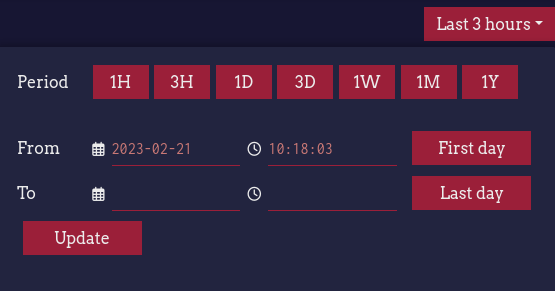
On the top-right corner the user can select the period of time to be plotted. When the button of the time period button is clicked a new pop-up window is displayed.

On the top part of the window there are some buttons to select time period presets. However, the user can manually set the starting and finishing date and time. If no finish date is selected, the current date and time is automatically chosen. Remember to click on Update after setting the appropriate time interval.
On the top-left corner of each plot there is a button with a triangular shape inside, which can be used to select the data to be plotted. The available options are:
- Anchor tension
- Inclination
- Fairlead tension
- Line damage
- Line damage rate
- Line utilization
- X
- Y
- Z
- Heading
- Pitch
- Roll
The first 6 options will be plotting the corresponding data for all the mooring lines, while the latter 6 options will be plotting the maximum and minimum of the corresponding motions of the platform.
The X and Y excursions are the offsets of the center of the platform with respect to the as-left position (latitude = 71.31120076 degrees, longitude = 22.25079239 degrees).
The Z offset is the vertical offset for the design draft (20.7 meters over the bottom of the platform) with respect to the ED50 UTM Zone 34(N) ellipsoid.
The Heading angle is the counter-clockwise angle between the platform north and the actual north.
Zoom on a specific time interval can be done by pressing Shift and moving the mouse wheel. It is also possible to select the time interval to be zoomed in by pressing and holding Ctrl, and then left clicking and dragging. Panning on the zoomed data is also posible just using the mouse wheel (releasing any eventual pressed key on the keyboard).
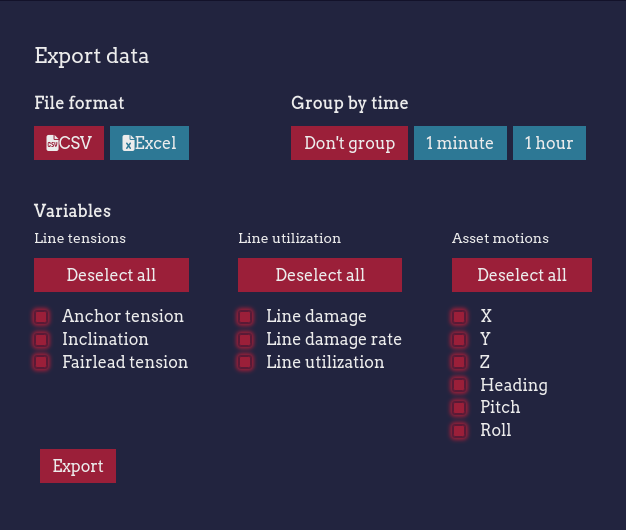
The data can be exported to either a CSV or a Microsoft Excel file, using the button Export data on the top-right corner.

Depending on the selected period of time and the selected data to be exported, the data might need to be aggregrated on intervals of either 1 minute or 1 hour.